Practical guide · Editor views
How to use editor layers to check a cross-stitch pattern
Compare a chart with its source photo, use grid lines and centrelines, and switch between filled, flat-colour, and symbol views in StitchBitz.
 Source
 Pattern
The same chart can answer different questions depending on how you look at it.
Colour view asks whether the picture reads. Symbols ask whether two threads are easy to tell apart. The source photo shows what the converter kept or lost. Grid lines and centrelines help you count and place the work.
None of these views is the one true pattern. They are more like tracing paper, a light box, and a ruler laid over the same drawing. Use the one that helps with the decision in front of you, then put it away.
First, a small naming truth
The Layers menu contains display controls. It does not create independent stitch layers that can be locked, reordered, or edited separately.
Turning a display control off does not delete stitches. It changes what you see while you work. Your PDF and JPG use the edited pattern data, not the current combination of layer switches.
This is good news for nervous clickers. You can hide the grid, show the photo, or turn off colour fills without harming the chart.
Open Layers and meet the display controls
Make a chart with the free cross-stitch pattern generator, then choose Edit. Select Layers in the toolbar.
The menu contains:
| Control | What it changes | Best used for |
|---|---|---|
| Filled | Shows DMC colour fills. Turn it off to see black symbols on the fabric background. | Checking whether the chart will remain readable without colour |
| Grid lines | Shows cell boundaries with darker guides every ten stitches. | Counting, painting one cell, and checking chart density |
| Centrelines | Shows horizontal and vertical dashed guides through the pattern centre. | Finding the middle and checking balance or symmetry |
| Source image | Places the original photo over the generated cells. | Comparing silhouette, features, and lost detail |
The toolbar also has a separate Render mode menu with Flat colour and Symbols, plus a Daylight or Warm 2700K lighting control.
What to notice
Layers menu open over the black cat editor, with all four labels and the Source image opacity slider visible.
View 1Use Flat colour to judge the picture
Keep Filled on, then choose Flat colour from Render mode.
This removes the symbol overlay and leaves the DMC colour blocks. Zoom out until you can see the whole pattern. Ask whether the subject reads without help from the source photo.
Flat colour is useful for checking:
- the silhouette against the background;
- the light and dark structure of a face or object;
- colour bands that look abrupt;
- a highlight that has grown too large;
- a patch that has become muddy after a substitution.
Do not edit every hard edge simply because it looks blocky. Cross stitch speaks in squares. A little stair-step on a petal or ear is part of the material, much like a visible join in a hand-built pot.
What to notice
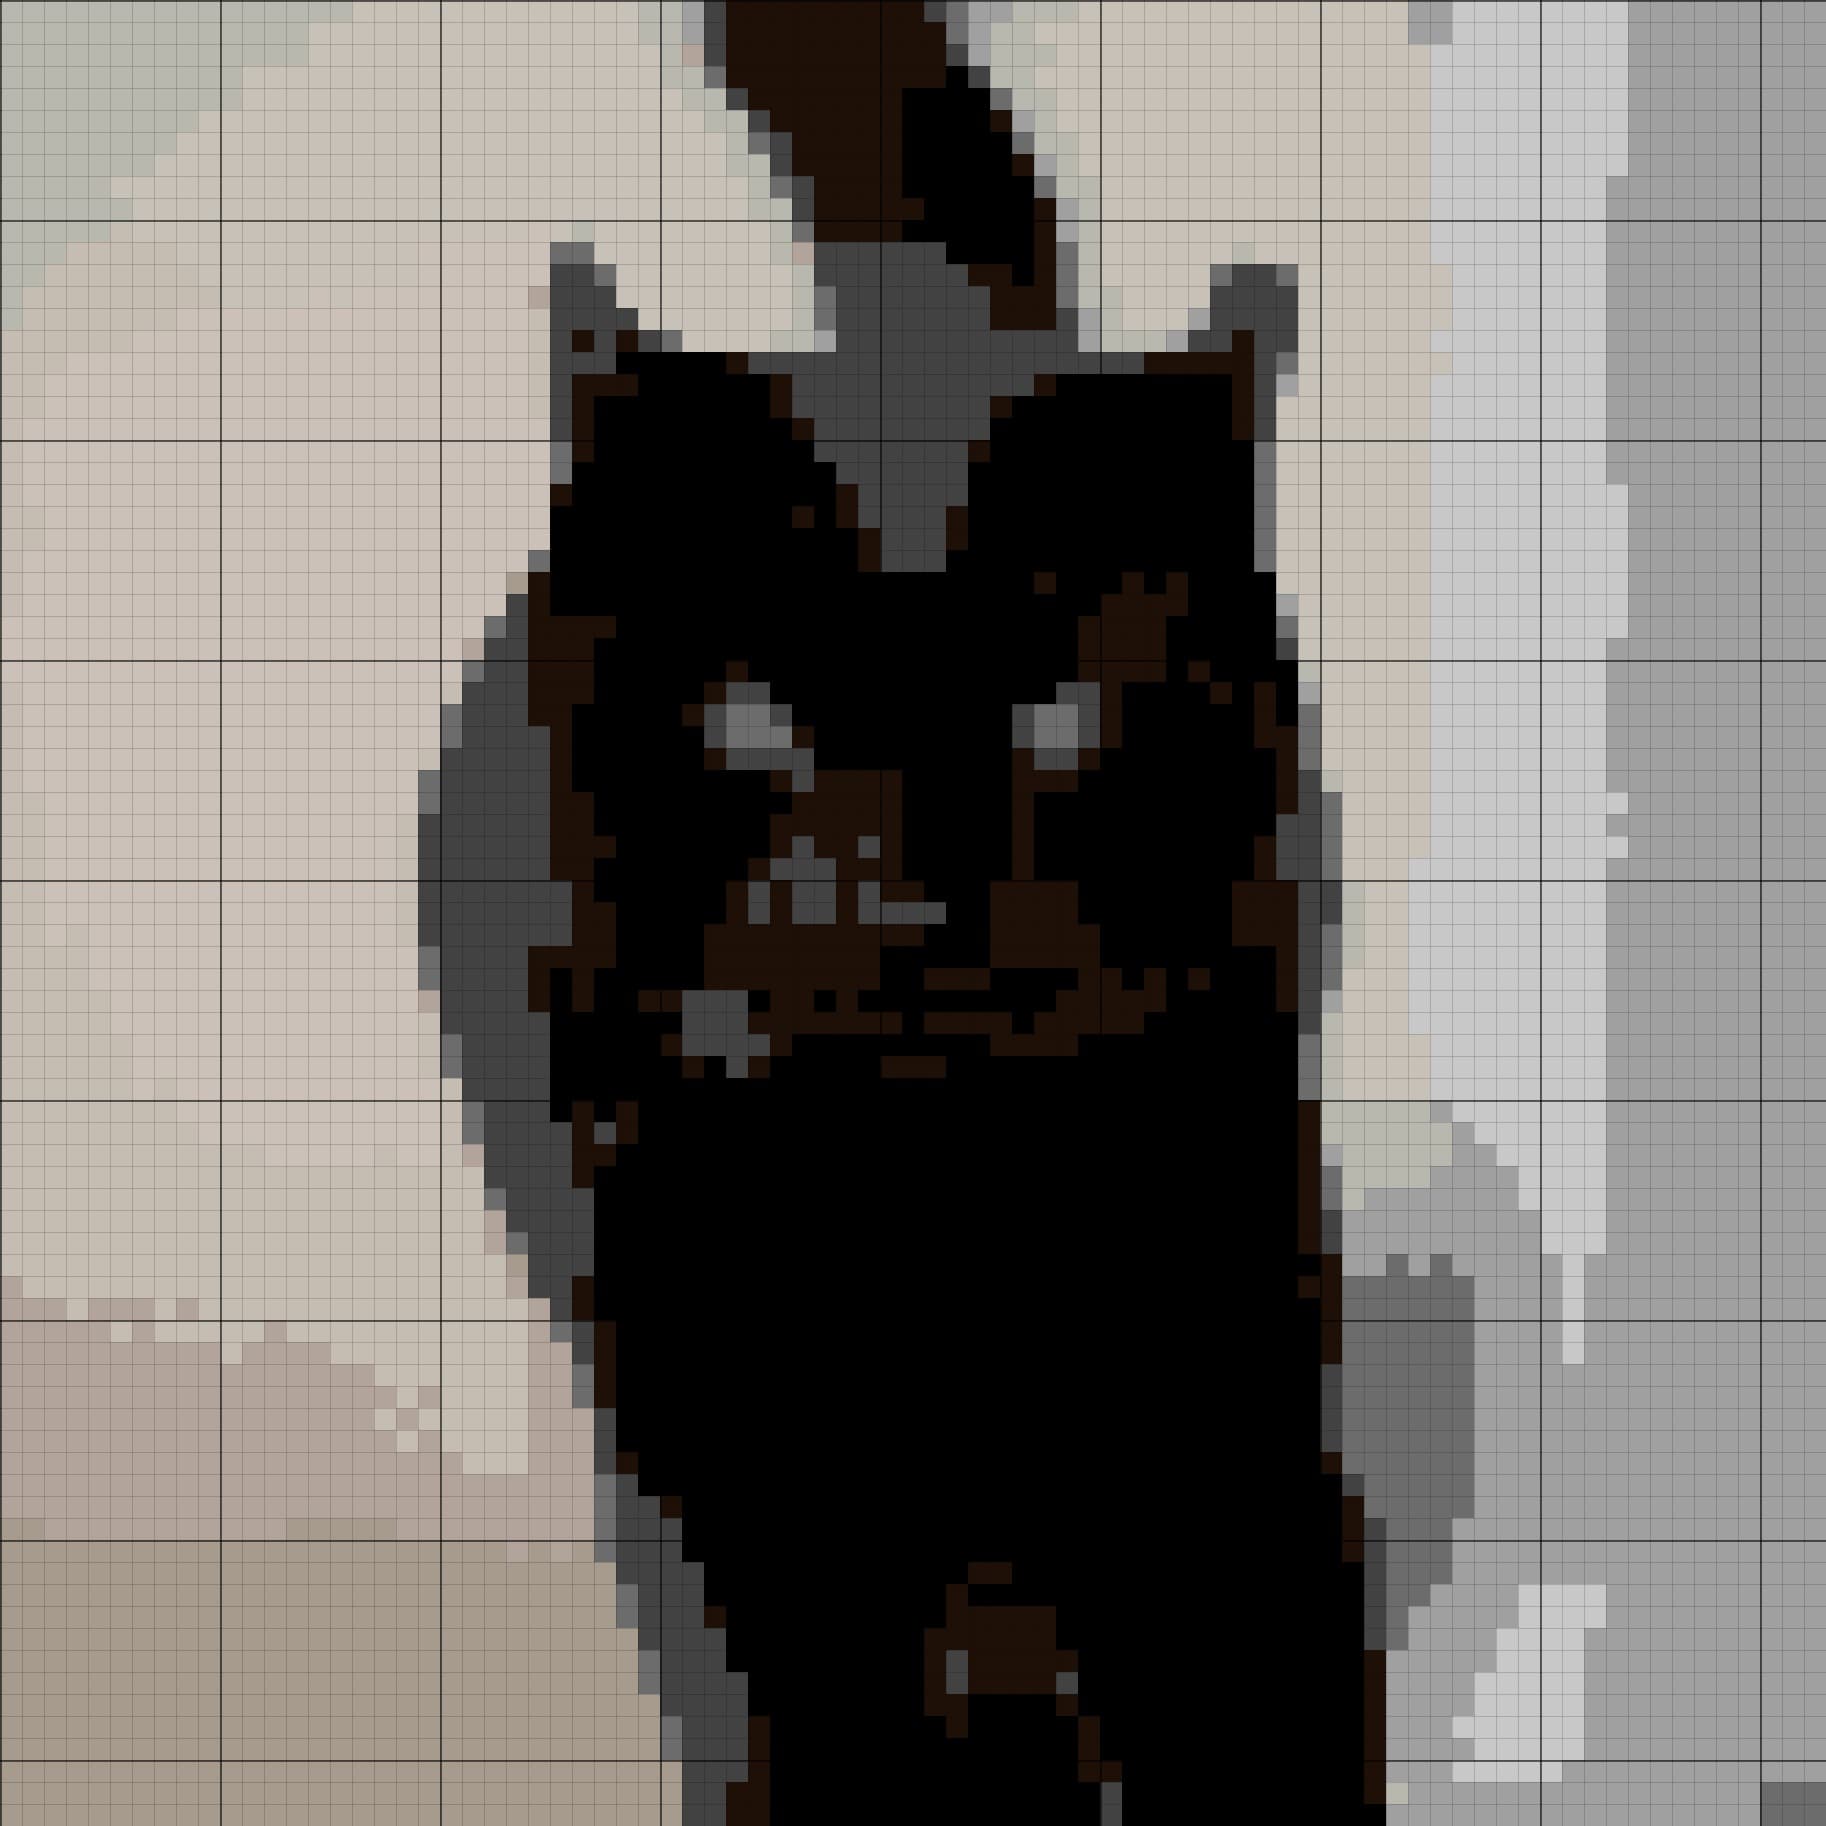
Whole black cat chart at Fit to screen in Flat colour, with Filled and Grid lines on.
View 2Lay the source photo over the chart
Open Layers and turn on Source image. On desktop, an Opacity slider appears below the menu. The default is 40 percent.
Start around 30 to 50 percent. The photo should be present enough to compare, but faint enough that you can still see the chart underneath.
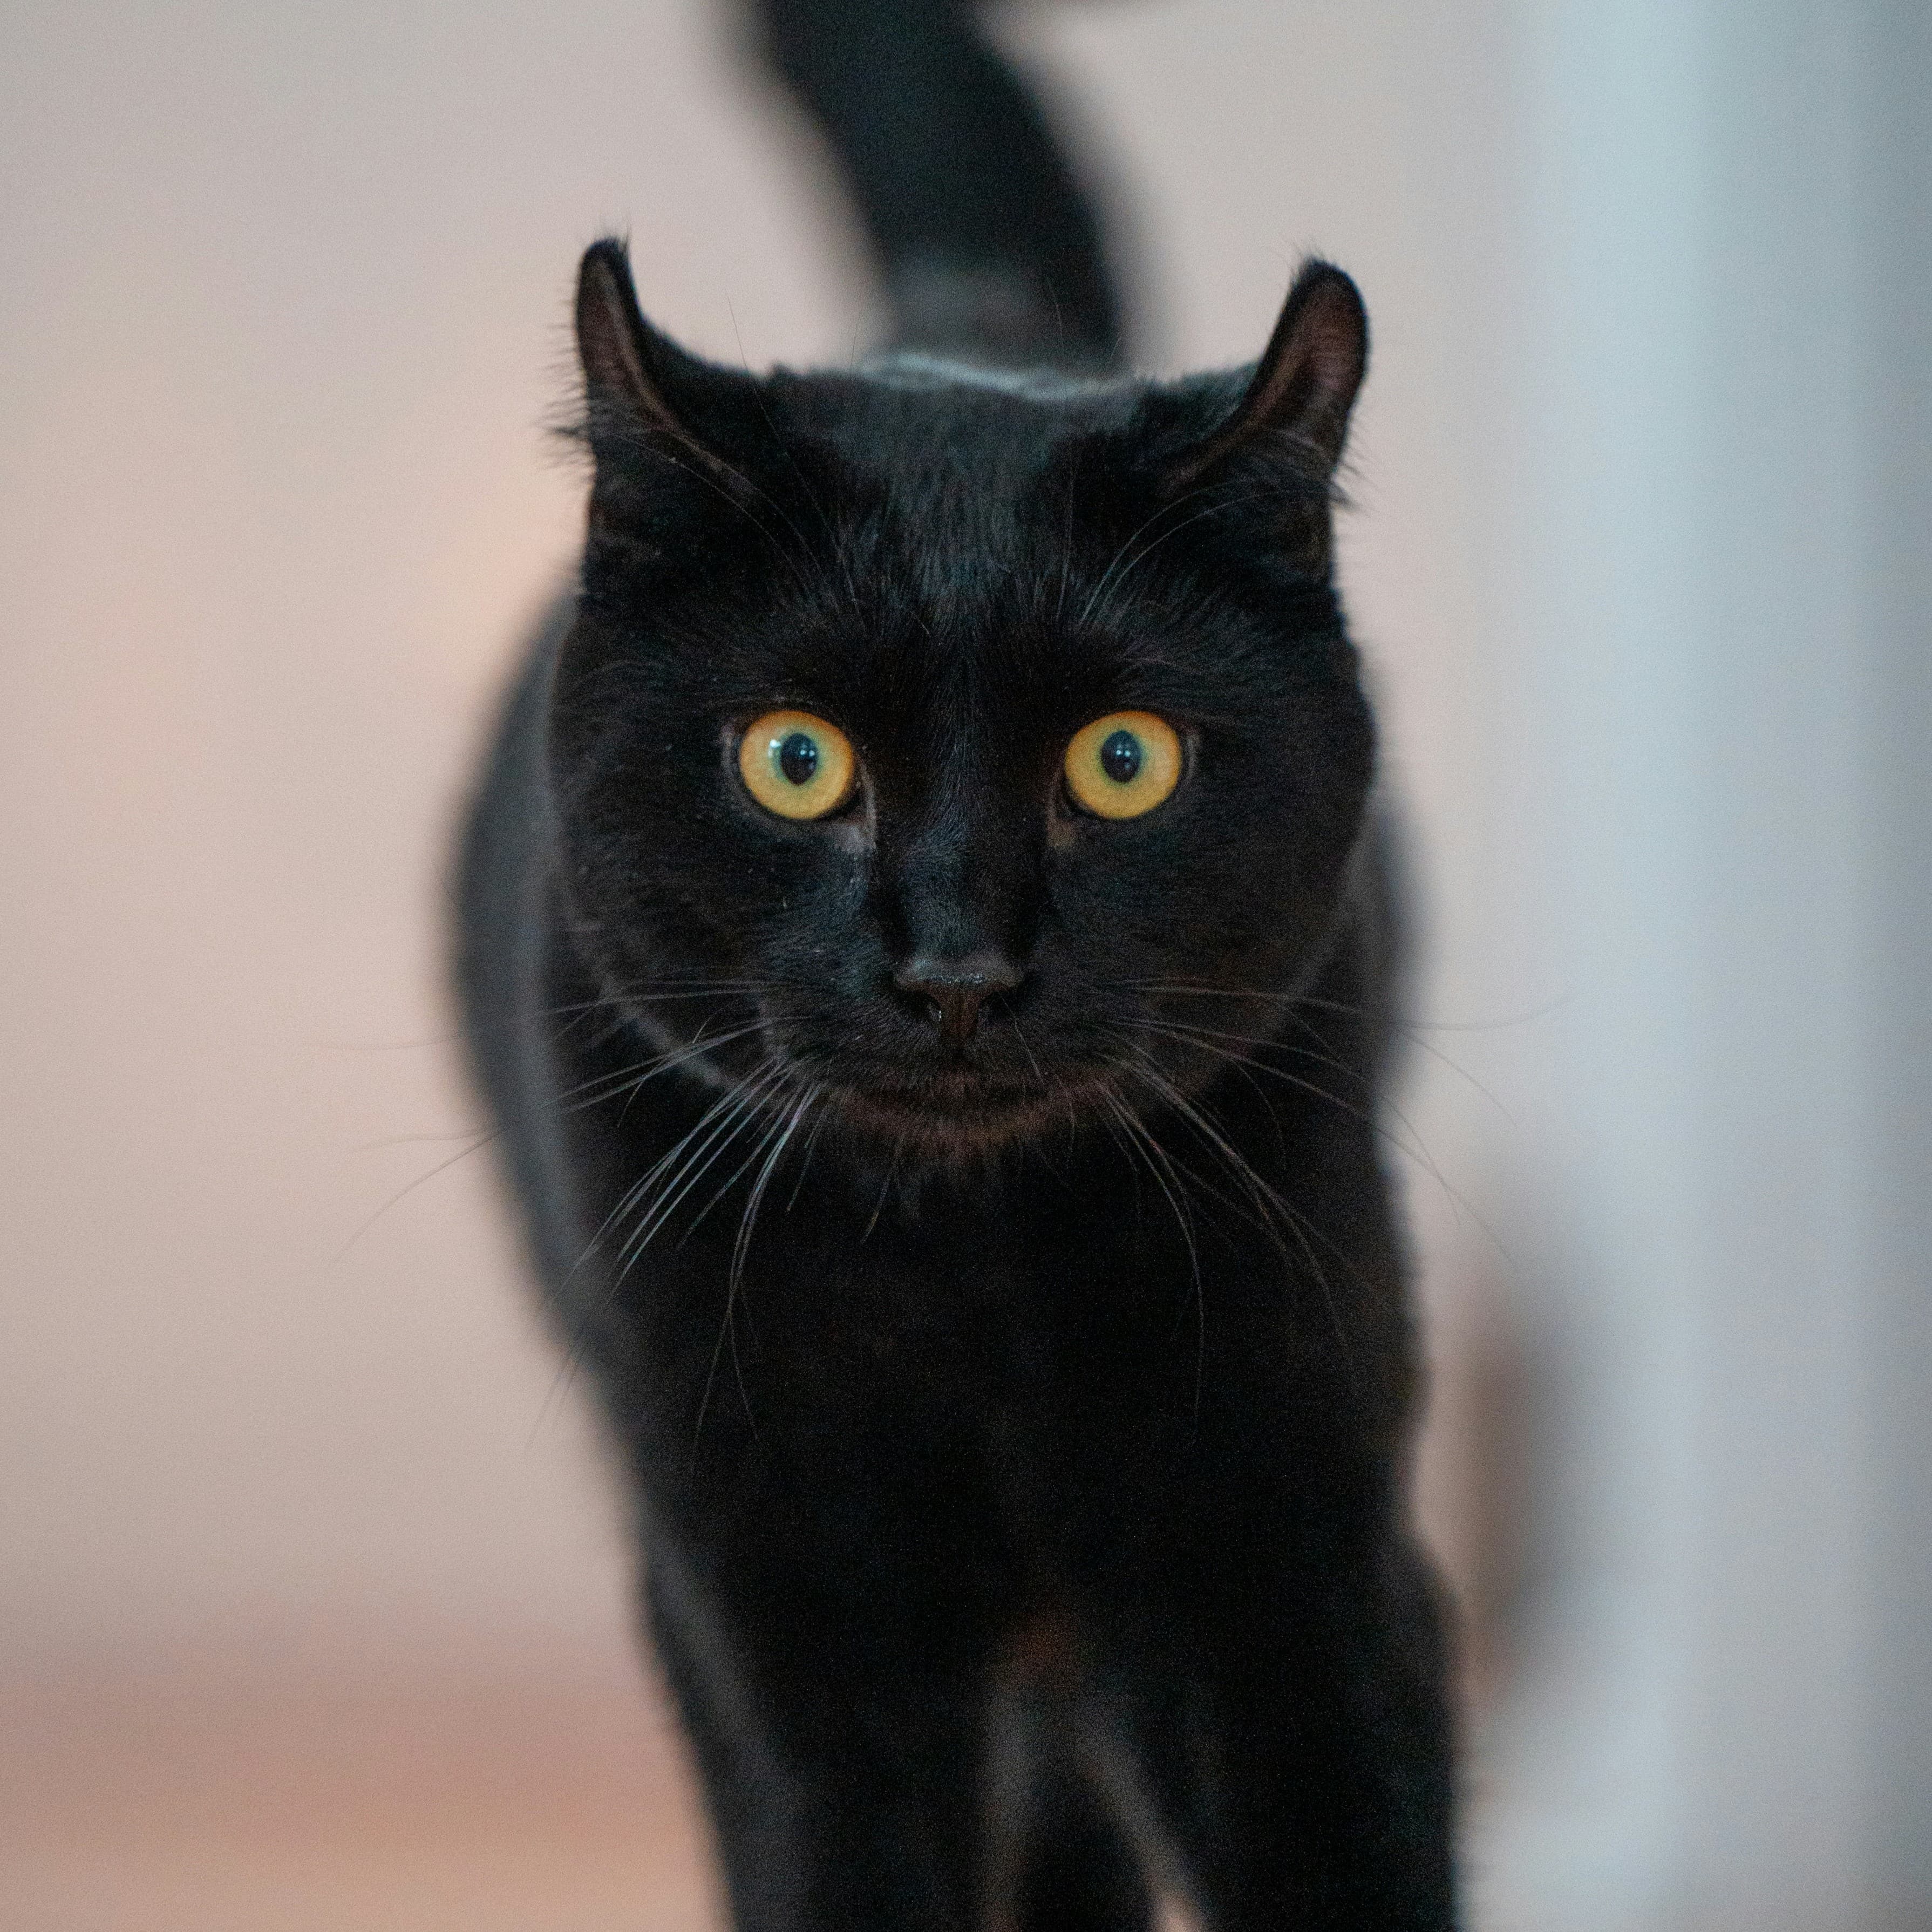
Look at the features that carry identity: the eye position, mouth, main petal edges, lettering, thin stems, handles, and the outside silhouette. If the chart differs from the photo in a quiet texture area, it may be simplifying wisely. If it loses the only line that explains an ear or expression, consider repainting that small area.
Source image opacity changes only this working overlay. It does not make stitches transparent and does not change the exported chart.
On mobile, open the colour-palette control sheet to find the layer switches. You can show or hide Source image there, but the current mobile sheet does not include the opacity slider. Use the desktop editor when you need precise overlay strength.
What to notice
Close crop around the cat's eye with Source image at 40 percent and the grid visible.
View 3Use Symbols to check working-chart clarity
Keep Filled on and choose Symbols from Render mode. Each coloured cell gains its chart symbol when you are zoomed in far enough.
This view helps when two DMC colours look similar on screen. Their symbols tell you which thread the chart expects, even when the swatches are close.
Check crowded areas for symbols that are too difficult to separate at your working zoom. If the patch contains many one-off symbols, the problem may be confetti rather than display. Use the confetti cleanup guide to decide what to keep.
Symbols are hidden automatically when cells become too small to draw legibly. Zoom in if a coloured chart appears to have lost them.
View 4Turn Filled off for a black-and-white symbol check
Open Layers and turn Filled off. StitchBitz removes the DMC fills and shows black symbols on the fabric background.
This is the closest working view to a traditional black-and-white chart. It is useful for checking whether the symbols, rather than screen colour, can carry the pattern.
If the pattern seems blank, zoom in. At a distant zoom, the cells are too small for symbols and StitchBitz hides them instead of drawing an unreadable smudge.
The Render mode choice matters while Filled is on. With Filled off, the editor uses the black-and-white symbol view regardless of whether the menu still says Flat colour or Symbols.
What to notice
Same cat eye crop with Filled off, black symbols visible, and the source image hidden.
Use Grid lines when the unit of work is one stitch
Keep Grid lines on for paint, erase, and colour-picking work. Thin lines mark each cell and stronger guides appear every ten stitches.
Grid lines are especially helpful when:
- you are cleaning a one-cell error;
- a diagonal edge needs a steady stair-step;
- you are comparing a symbol with the source photo;
- you are counting from a known landmark;
- the brush has grown beyond 1 x 1 and you need to see its footprint.
At a distant zoom, fine grid lines may simplify or disappear so the canvas does not turn grey. Zoom in before making cell-level edits.
Turn the grid off briefly when you want to judge the image as a whole. A trellis is useful while training a vine, but you still need to step back and see the plant.
Use Centrelines to find the middle, not to promise perfect symmetry
Turn on Centrelines to show dashed guides through the horizontal and vertical centre of the pattern.
They help you find a starting point, compare the weight on both sides, or keep a centred motif from drifting. They do not mirror your paint strokes or force the design to be symmetrical.
A photo subject may sit slightly off-centre and look better for it. Use the guides as a measuring tape, not a set of rails.
Check Daylight and Warm 2700K before merging close shades
The lighting button switches the editor between Daylight and Warm 2700K. Warm view adds a lamp-like cast to the on-screen thread colours.
Toggle it when two greys, creams, or skin tones seem close. If they collapse into one patch under warm light, ask whether both are earning a place in the chart.
This is a screen simulation, not a colour-proofing tool. Your monitor and physical thread will behave differently. Use real skeins and fabric for any decision where exact colour matters.
The lighting state is not exported.
A practical inspection order
When you are not sure which view to use, follow the work from broad shape to stitch-level detail:
- Choose Fit to screen, keep Filled on, and use Flat colour.
- Turn on Source image at a moderate opacity and compare the focal features.
- Hide Source image, switch to Symbols, and zoom into the busy areas.
- Turn Filled off and confirm the black-and-white chart remains readable.
- Turn on Centrelines if placement or balance matters.
- Return to your preferred working view and make one small edit.
- Zoom out again before accepting it.
The loop matters. A square can look wrong up close and completely right in the whole picture.
When the chart has passed the layer check
Stop switching views when they agree on the essentials. The subject reads in colour. The source comparison protects the key features. Symbols make the working chart followable. The grid and centrelines give you enough landmarks to count.
No view needs to be flawless. The layers are there to answer questions, not create new ones forever. Once the chart is clear, let done win and move to materials.
One useful pass is enough to begin
Make the chart, improve one patch, then call it ready
Organic shapes in the real world rarely have razor-sharp edges. Embrace the unique edges in your chart—they give your handmade pattern its character.
Keep refining
Related guides
Estimate materials and download
Mark the thread you own, check the estimates, note any tweed cells, and choose the PDF or JPG that suits your next step.
Clean up confetti stitches
Decide which isolated stitches carry useful detail, then erase or repaint the ones that only create extra thread changes.
Change or replace DMC colours
Add an exact DMC code or find the nearest shade, then test the replacement without losing the design’s light and dark structure.